Required to Start using Breakdowns
To start using the Breakdowns in Custom Workspace, you must first have initialized the ByteBrew SDK and integrated custom events in your game.
Building Breakdowns
Watch Video play_circleUsing Custom Breakdowns dashboard you have the ability to analyze a custom event's user engagement that you've tracked in your game or app. See the sections below to learn how to start using breakdowns on the ByteBrew Breakdowns dashboard.
Setting up a Breakdown
To setup a Breakdown, open the Breakdown Settings panel by clicking the "Create Breakdown" button. Follow the steps below to set up your Breakdown:
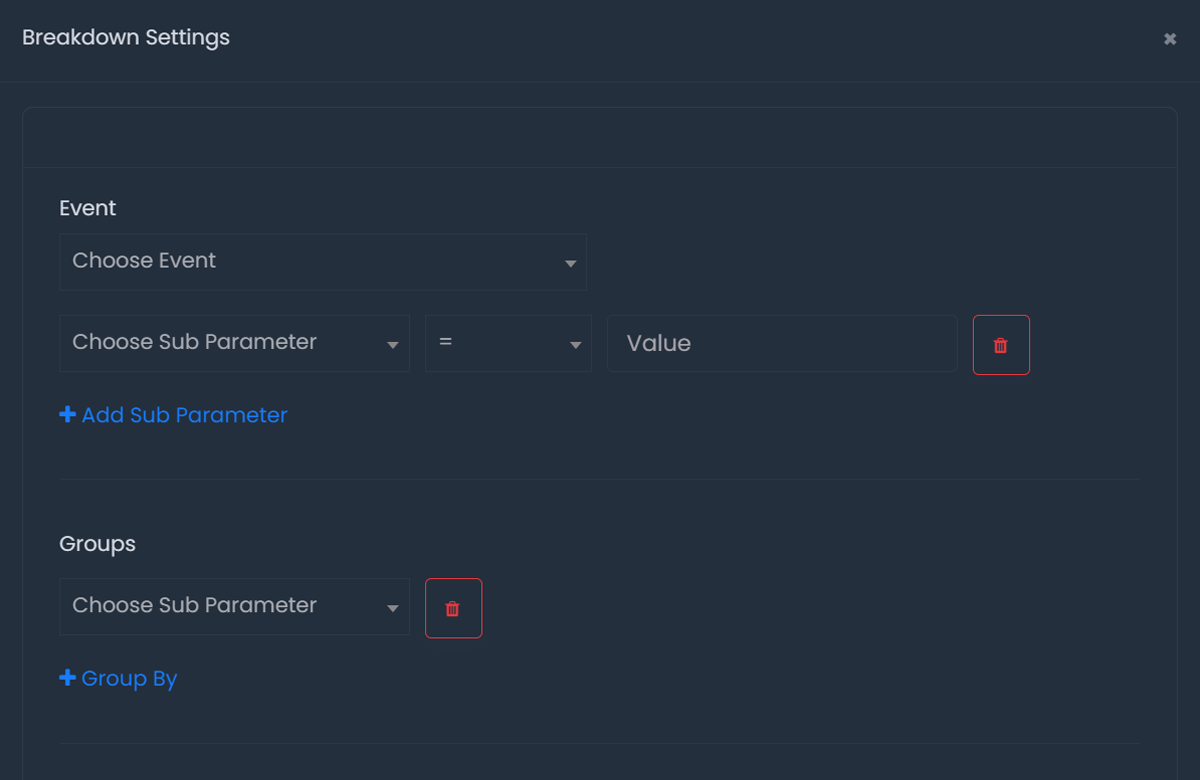
Choose the custom event you want to analyze from the Event dropdown.
Optional: Add subparameters you want that custom event to be filtered by in the step. Note: It is not recommended to filter an event by a subparameter and group by that same subparameter.
Select Add Group By to choose dimensions you want to breakdown the Event by in the outputed Breakdown datatable.
Repeat Step 3 to add any other dimensions you want to Group By in the Breakdown.
Optional: Add Aggregates you want to calculate using the Custom Event that will output in the Breakdown datatable. See below section on Add Aggregates for more info about aggregate functions.
Add Aggregates
Under the Breakdown Settings panel you have the option to Add Aggregates to your Breakdown datatable during your breakdown setup. Adding an Aggregate will enable you to add a calculation using aggregrate functions on your event and have your calculated aggregate output into the Breakdown datatable. For example: if you add an average aggregate function for a subparameter called "AmountSpent" in a breakdown for the custom event "VirtualCurrentPurchase" then your datatable will add the average amount spent under your virtual current purchase event to the datatable output. See steps below on how to add an Aggregate to your Breakdown:
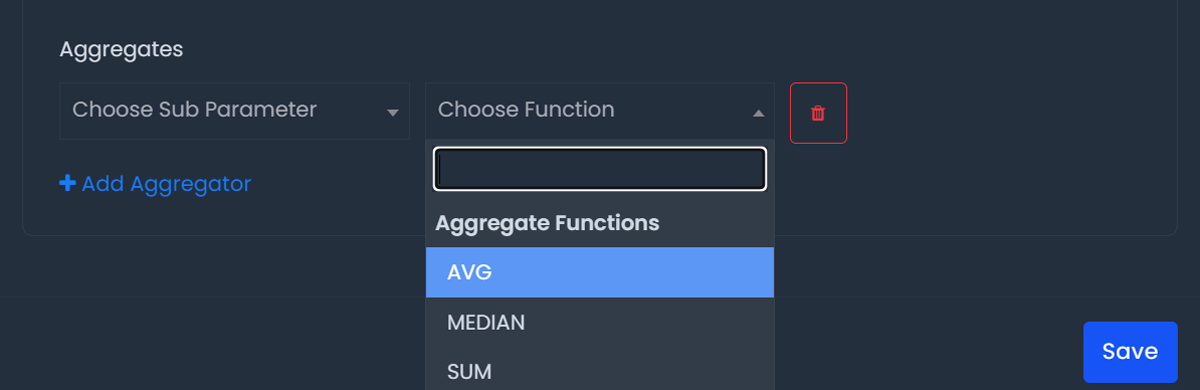
Select Add Aggregate under the Breakdowns Settings panel.
Define the item you want to aggregate by Aggregate options include: value and tracked subparameters of the event selected.
Choose the calculated function you want to apply to the aggregate you've chosen. See list of available functions below:.
Apply Filters to Breakdowns
Breakdowns is filterable by our extensive filter set. All available filters can be found under the "Breakdown Filters" button. To add filters to your Breakdown go into the Breakdown Filters panel and select the filters you'd like to apply.
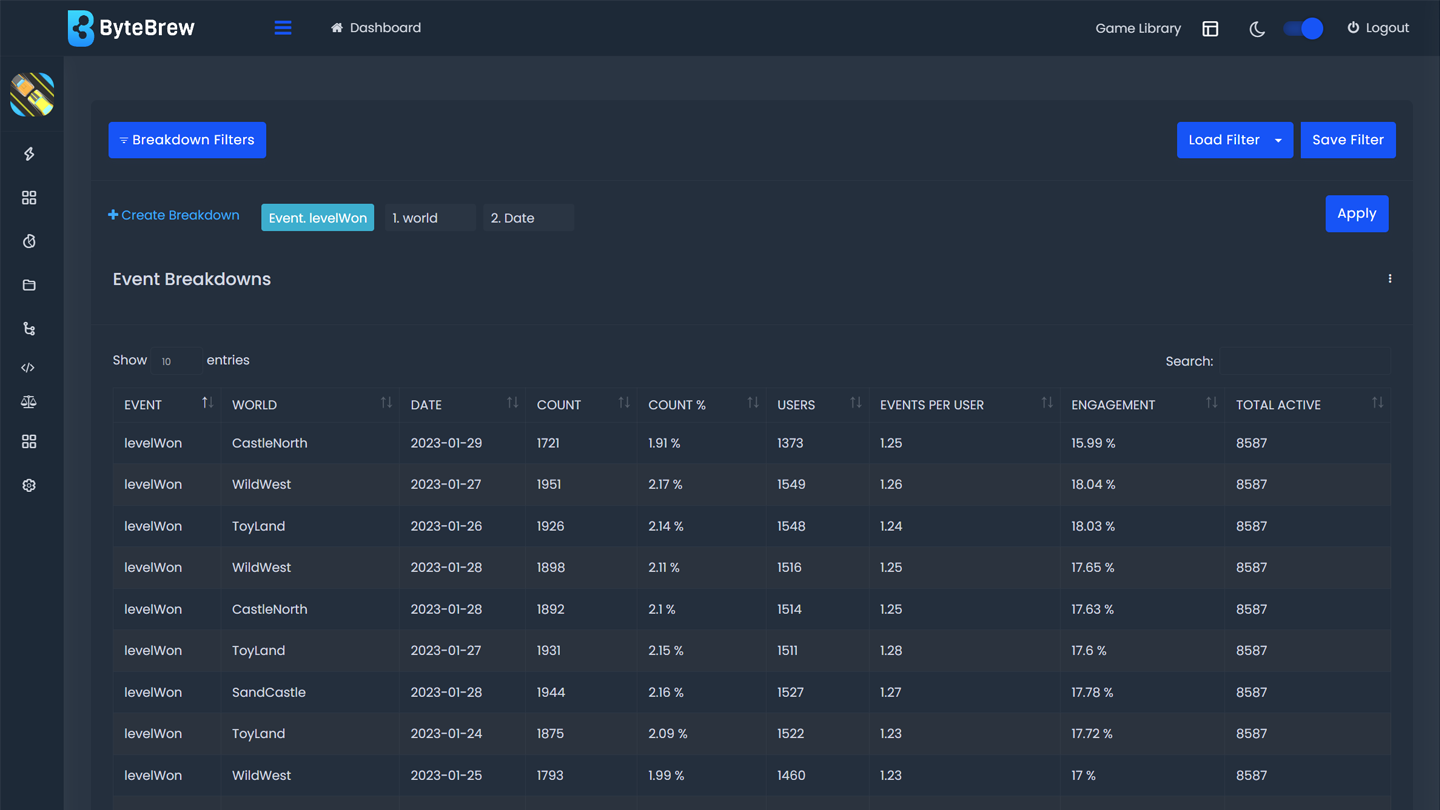
Breakdown Datatable
Breakdowns output a datatable with the information you queried while setting up the breakdown. In the datatable you will see the following information in the table below:
| Event | Name of the event queried in the breakdown. |
|---|---|
| Group By's | Columns of all the dimensions that you've broken the event by. |
| Aggregators | Columns of all the aggregate calculations that you've created. |
| Count | Total number of events tracked. |
| Count % | Percent of events counted based on the total count of events in the query. |
| Users | Number of Users who interacted with that row's events. |
| Events per User | Number of event counted divided by the number of users who participated in the row. |
| Engagement | Calculated by the number of users who interacted with the event in the row by the number of total users in the query. |
| Total Active | Total number of users who were active during the date range of the query. |
Saving Breakdowns
After building a Breakdown, you have the option to save it; so you don't need to re-build the same breakdown query each time. Follow the steps below to save a breakdown:
After building your breakdown, open the Save Filters panel by clicking the "Save Filters" button.
Type the name of the filter you're saving to remember what the filter you built.
Optional: Create Chart You have the option with Custom Workspace to save the breakdown as a persistent custom breakdown table that will populate in real-time, continously in your "Saved Breakdowns" dashboard under the "Saved Dashboards" tab of the dashboard. To do this, click the checkmark box called "Add this query to your Saved Breakdowns dashboard".
Optional: Adding Chart Info If you have opted to add this breakdown as a saved table, you have the option to "Title", and add a "Description". See list below for definitions of each:
Loading Breakdowns
Any breakdown you save can be reloaded later into the Breakdowns dashboard by clicking the "Load Filters" button to open the Load Filters panel. See the options list below the Load Filter panel:
Exporting Charts
Every chart on the ByteBrew dashboard is able to be exported via .csv by clicking on the three dots icon in the corner of the chart.
FAQs
In a breakdown, we do not limit the number of groups you can breakdown by. You can get as granular as you need.
Yes, to edit a saved Breakdown filter, load the Breakdown filter into the page to populate the saved settings, then make your changes to the filter and save your new edits over the current settings to overwrite the saved filer.