Required to Start using Mechanics
To start using Mechanics in Custom Workspace, you must first have initialized the ByteBrew SDK and integrated custom events in your game.
Building Mechanics
Watch Video play_circleYour visual analytics playground, Mechanics gives you the ability to design your own customized queries to examine your game's data in the exact format you want. See the sections below to learn how to build queries on the ByteBrew Mechanics dashboard.
In the Mechanics dashboard there were several steps to building your analytical query. See the following overview steps and their individual sections to learn how to build Mechanics queries for your games and apps:
Set up your Events to analyze.
Create Segments of Users and link them to your Events.
Optional: Choose how you want to Breakdown your query.
Optional: Build a formula using your selected Events.
Select the Chart type you want visualized.
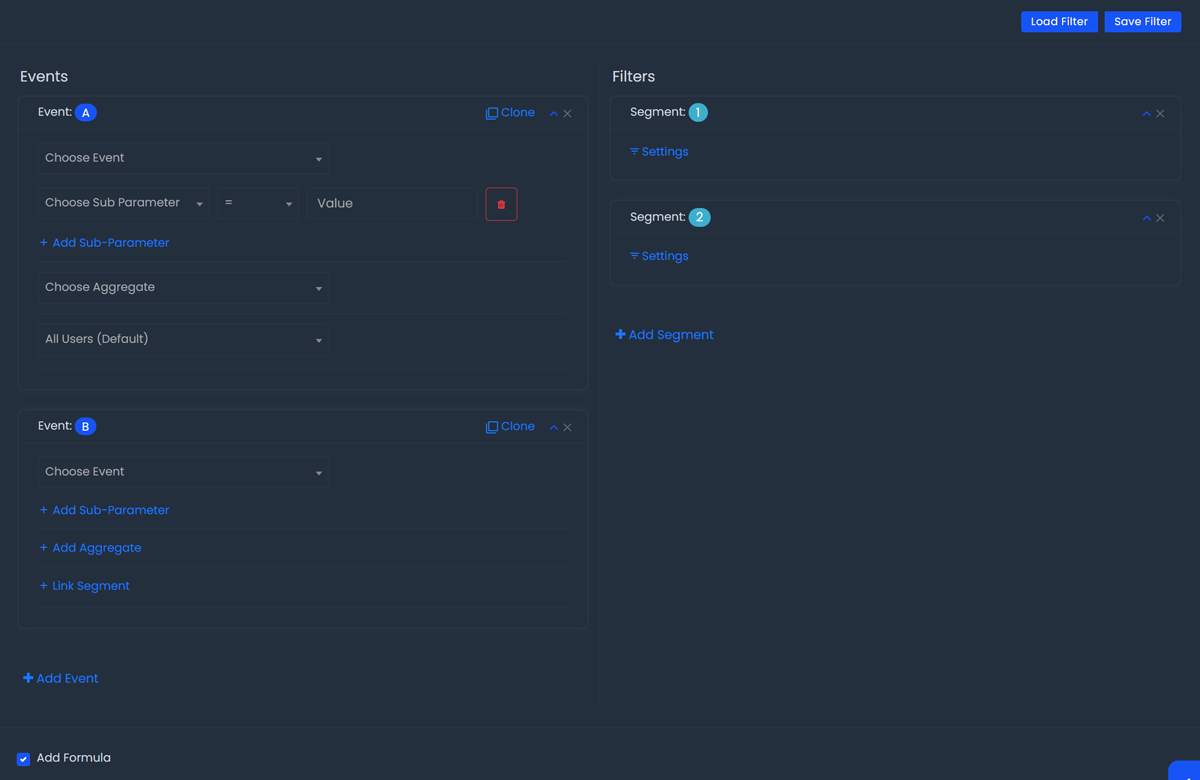
How to Set Up Events
To set up the Events you want to analyze in the Mechanics dashboard, click the "+ Add Events" button under the Event Column of the dashboard to create your first event. See steps below on how to define the event you set up:
Choose the Event: Select the event you want to analyze under the Choose Event dropdown.
Optional: Add Subparameters Define any subparameters under the event that you want to filter by.
Optional: Add Aggregate Select an aggregate function you'd like to aggregate the chosen event by. See list below for aggregate options:
Optional: Link a Segment Select "+ Link Segment" to attach a user segment that you've already defined under the Segments Column of the Mechanics Dashboard. Any segments already set up will automatically populate under this dropdown. If you do not have any segments setup, learn how to set them up under the section below.
Click "+ Add Event" button to add an additional event to analyze and repeat the above steps.
How to Build User Segments
After setting up your events for the Mechanics dashboard, you can create individual user segments to refine what users you want each event to be filtered by. To set up Segments click the "+ Add Segment" button under the Segments Column of the dashboard. See steps below on how to define the segments you set up:
Click the "Settings" Button to top the Segment settings panel.
Select the filter you'd like to apply to this segment of users.
Link the segment to an Event you've set up under the Events Column of the dashboard. Any unlinked segments will be ignored when the query is run.
How to Add Formulas
Once you've set up your events, you can build formulas to be calculated by using the events you've constructed. To add a formula to your analysis, follow the steps below:
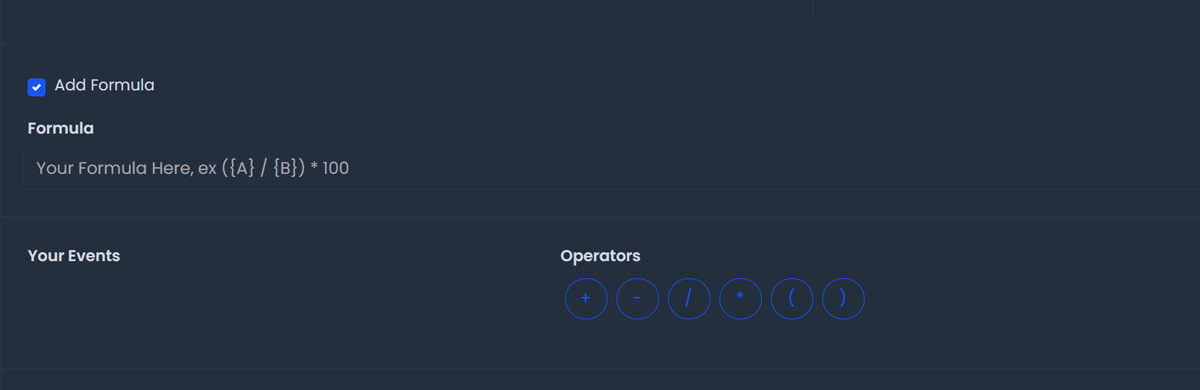
Click "Add Formula" checkbox to dropdown the formula settings panel into the Formulas textbox.
Input your formula using the event and math operator buttons in the panel. See below for example valid formulas
Examples of Valid Formulas: Below is a list of example valid formulas you can take inspiration from to build your own functions:
Examples of Invalid Formulas: Below is a list of example invalid formulas:
How to Add Breakdowns
An option you have when building a Mechanic query is adding Breakdowns. Adding breakdowns will split/group the game's data you query by the specific breakdown you choose. To add breakdowns to your analysis, follow the steps below:
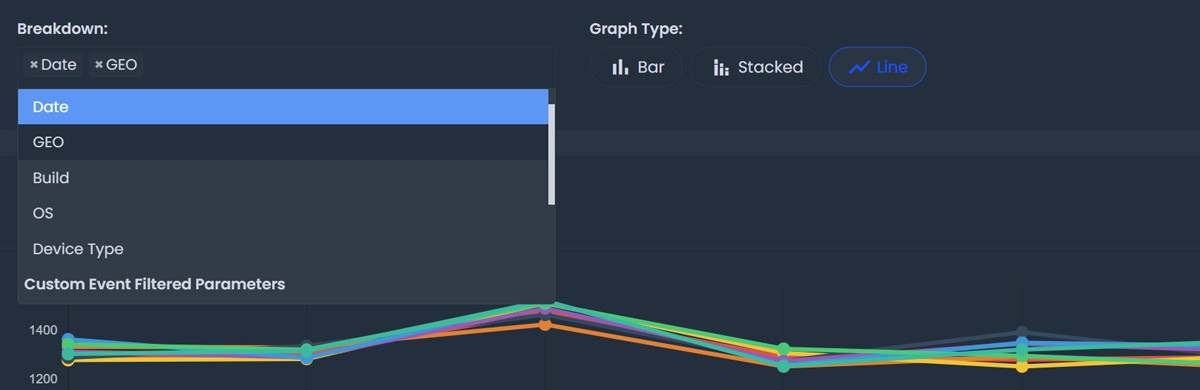
Click the Breakdowns dropdown and choose the breakdowns you want to group your query's output by.
Breakdown Options: See list of available breakdowns on Mechanics.
Select Chart Type
One of the last steps to building a mechanic query is selecting which chart type you want your data visualized in. See table below for the list of chart types:
| Bar Chart | Outputs a horizontal bar chart for the Mechanics Graph. |
|---|---|
| Stacked Bar Chart | Outputs a horizontal stacked bar chart using two dimensional depths for the breakdowns you've selected as the Mechanics Graph. |
| Line Chart | Outputs a line chart for the Mechanics Graph. Line is the Default Chart. |
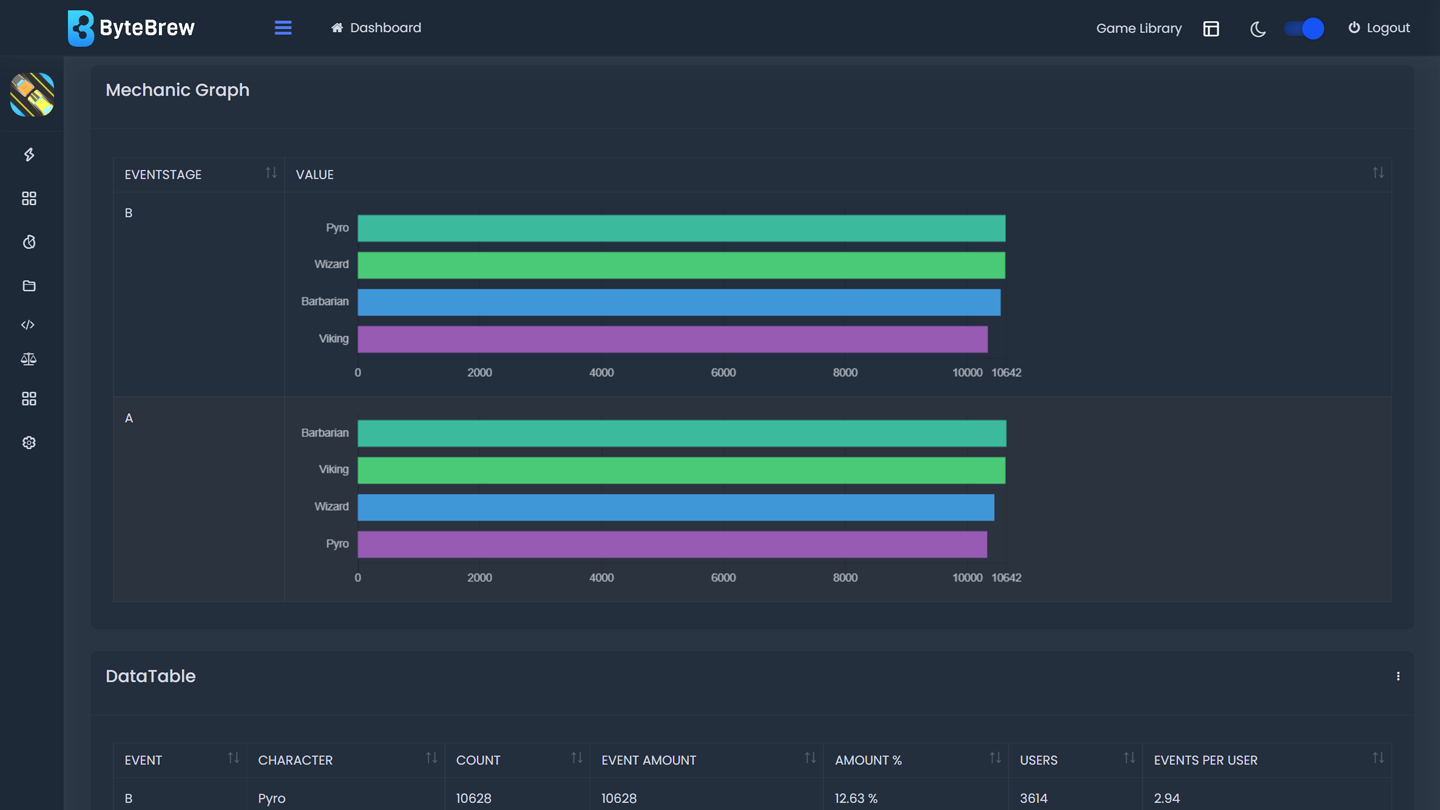
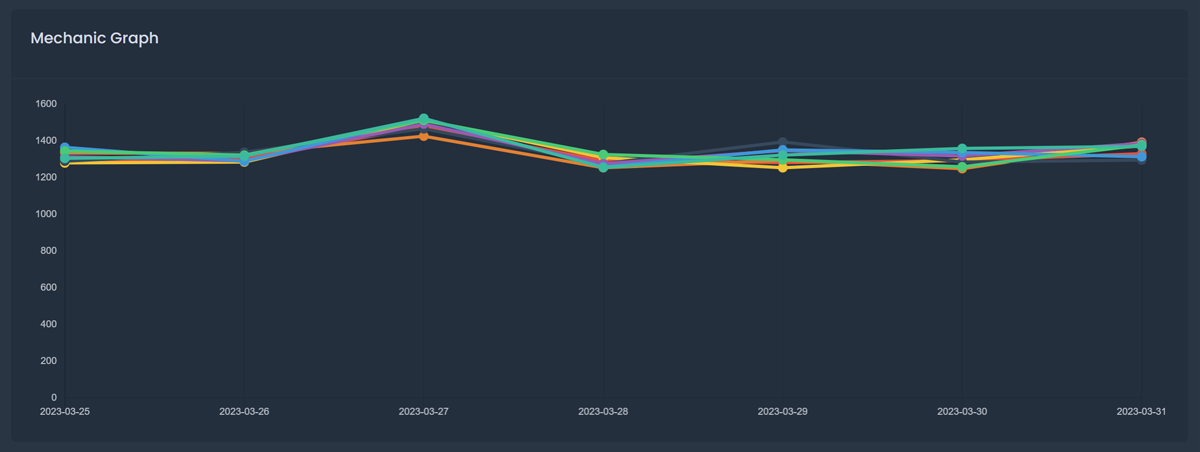
Mechanics Graph
The chart you select when building your query will be the outputed graph. Hovering over the graph you will see the data outputs.
Mechanics Datatable
In addition to the chart you've built, Mechanics will output a datatable. In the datatable you will see the following information in the table below:
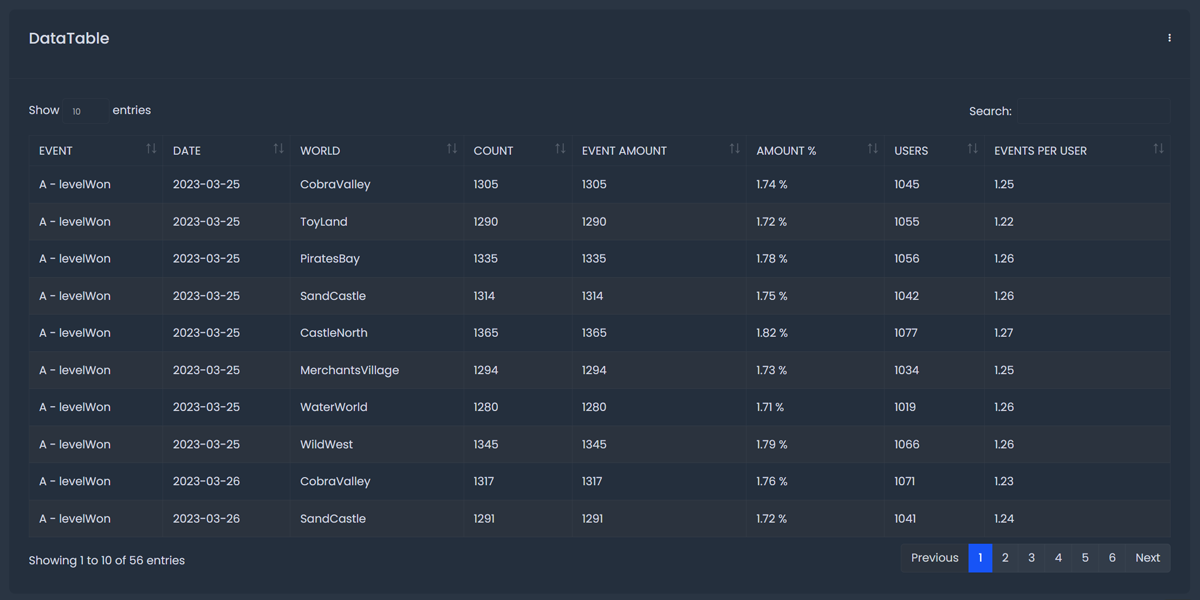
| Events | First column of the table will be the Events that you've setup in the query. |
|---|---|
| Breakdown | The following columns in the table will be any of the breakdowns you've selected when building the query. |
| Aggregate | Next in the table is the Aggregate value you've selected in the query. Default value for aggregate is Count. |
| Event Amount | Total count of events that users performed for each row in the query. |
| Amount % | The percentage amount of events in a single row compared to the total number of events in the query. |
| Users | Total number of users who participated in the single row of the query. |
| Events Per User | The average number of events calculated per user in the row. |
Saving Mechanics
After building your query, you have the option to save it; so you don't need to re-build the same query each time. Follow the steps below to save a Mechanic:
After building your Mechanic, open the Save Filters panel by clicking the "Save Filters" button.
Type the name of the filter you're saving to remember what the filter you built.
Optional: Create Chart You have the option with Custom Workspace to save the Mechanic query as a persistent chart that will populate in real-time, continously in your "Saved Mechanics" dashboard under the "Saved Dashboards" tab of the dashboard. To do this, click the checkmark box called "Add this query to your Saved Mechanics dashboard".
Optional: Adding Chart Info If you have opted to add this query as a saved chart, you have the option to "Title", add a "Description", and choose "Chart Type" to this chart. See list below for definitions of each:
Loading Mechanics
Any Mechanics you save can be reloaded later into the Mechanics dashboard by clicking the "Load Filters" button to open the Load Filters panel. See the options list below the Load Filter panel:
Exporting Charts
Every chart on the ByteBrew dashboard is able to be exported via .csv by clicking on the three dots icon in the corner of the chart.
FAQs
Yes, to edit a saved Mechanics filter, load the Mechanics filter into the page to populate the saved settings, then make your changes to the filter and save your new edits over the current settings to overwrite the saved filer.
ByteBrew supports historical queries on data up to 24 months.