Required to Start using LTV
LTV utilizes all your app's revenue sources. Requisites for using LTV will depend on how you monetize in your game. See the table below for requirements based on how you monetize:
| Monetization Channels | Required Integrations |
|---|---|
| App monetizes with both In-App Purchases & In-Game Ads | 1. Integrate ByteBrew SDK 2. Implement Purchase Validation (or Purchase Tracking) in your game. 3. Implement Ad Events to stream in impression level revenue from your game. |
| App only monetizes with In-App Ads | 1. Integrate ByteBrew SDK 2. Implement Ad Events to stream in impression level revenue from your game. |
| App only monetizes with In-App Purchases | 1. Integrate ByteBrew SDK 2. Implement Purchase Validation (or Purchase Tracking) in your game. |
How to integrate In-App Purchases
In-App Purchase integration takes place in the implementation process of the ByteBrew SDK. Go to your platform's SDK documenation page to learn how to track and validate purchases using ByteBrew. When In-app purchase tracking has been integrated, then purchases will auto-populate on the Monetization dashboards.
How to integrate In-App Ad Tracking
In-App Ads integration takes place in the implementation process of the ByteBrew SDK. Go to your platform's SDK documenation page to learn how to track ad events using ByteBrew. When in-app ad tracking has been integrated, ad events will auto-populate on the Monetization dashboards.
Building LTVs
Using the LTV Dashboard, you have the ability to analyze the real lifetime value of different segments of users by tracking revenue from all your app's revenue sources. See the sections below to learn how to build a LTV reports and maximize your insights on the ByteBrew LTV Dashboard.
Setting up Events for LTV
To setup an LTV query, follow each of the steps below:

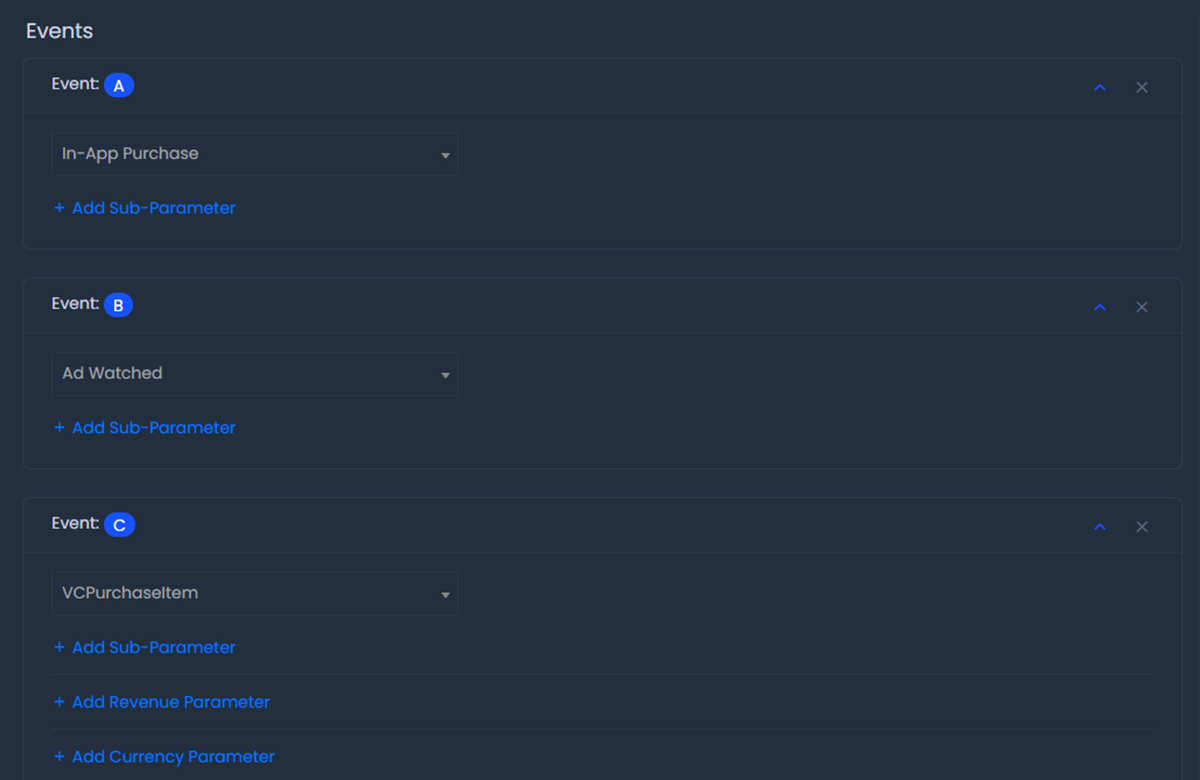
Select your revenue events for the LTV: There are three types of events the can be used in the LTV dashboard (Purchase Events, Ad Events, and Custom Events). See the section below to learn how to setup different types of events:
Timespan Settings
In the LTV Settings you have the power to set a specific time scale to analyze as well as the LTV Range you'd like to calculate. See below for the options to calculate your app's LTV:

Breakdown By
Under the LTV Settings panel you have the option to add a Breakdown function. Adding a breakdown will allow you to output a LTV calculations based on the value that you've selected to breakdown by. See breakdowns options below for your LTV calculations:

LTV Prediction
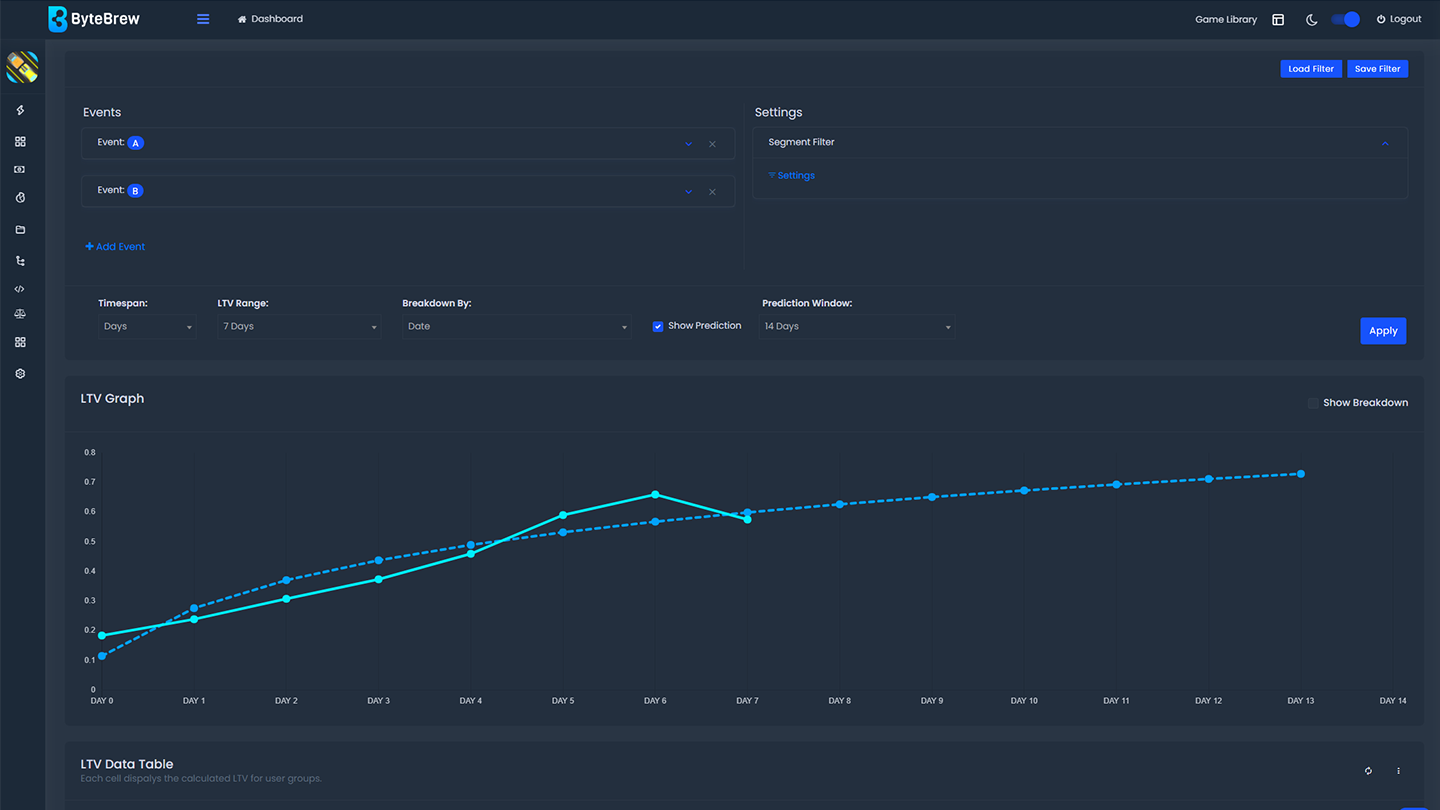
Under LTV settings you have the option to select a prediction window that projects forward a forcasted fitted LTV curve based on a logarithmic regression model. See steps below on how to add an prediction window to your LTV query:

Select to enable "Show Prediction" checkmark box to display the prediction window selector.
After enabling Show Prediction, add a Prediction Window range in the dropdown. See below list to see the full list of options for prediction:
Apply Filters to LTVs
LTVs are filterable by our extensive filter set. All available filters can be found under the "Segment Filter" settings area. To add filters go into the Filters panel by opening the "settings" and select the filters you'd like to apply.
LTV Graph
The LTV Graph will output a visual graph of the LTV query you build. This graph will plot a line based on the average values in your query. Hoving over the plotted points will show the data it represents.

LTV Datatable
In addition to the chart, LTV will output the calculated query in a datatable. In the datatable you will see the following information in the table below:

| Breakdown | First column in the table will be the breakdown selected when building the LTV. Default breakdown is Date |
|---|---|
| Total Users | Total unique number of users for each row in the LTV. |
| LTV Table Value Output | The LTV output make up the rest of the datatable cells. Inside each cell is the calculated LTV value. |
How is Real LTV Calculated?
On ByteBrew, LTV is calculated by measuring the real life-time value being tracked by each of your players from all the revenue sources they monetize with in your app.
How is Predicted LTV Calculated?
LTV prediction line is produced by taking the weighted average of each cohort's data and developing a logarithmic regression curve to project a lifetime value forward.
Saving LTVs
After building an LTV, you have the option to save it; so you don't need to re-build the same LTV query each time. Follow the steps below to save a LTV queries:
After building your LTV, open the Save Filters panel by clicking the "Save Filters" button.
Type the name of the filter you're saving to remember what the filter you built.
Loading LTVs
Any LTV you save can be reloaded later into the LTV dashboard by clicking the "Load Filters" button to open the Load Filters panel. See the options list below the Load Filter panel:
Exporting Charts
Every chart on the ByteBrew dashboard is able to be exported via .csv by clicking on the three dots icon in the corner of the chart.
FAQs
All analytics on ByteBrew show up in real-time. There aren't any wait periods like other platforms. Seconds after your user's play your game, you will see data start showing up on the dashboard.
This depends on how you monetize your games. If you have IAPs in your game, then you must initialize the ByteBrew SDK and implement Purchase Tracking (or Purchase Validation). If you only use in-app ads to monetize, then you must initialize the ByteBrew SDK and implement Ad Event Tracking. If you use both IAPs and in-app ads, then you must implement the ByteBrew SDK, and integrate both purchase and ad events.
The dashboard operates in UTC time.
Yes, ad revenue in ad events should be sent in USD.
If revenue is not displayed as expected, check (1) that you've properly implemented both purchase and ad events, and (2) test the output of each event type to ensure the revenue values are being sent to ByteBrew as expected.
During comparative testing on live data, logarithmic regression curves produced the best prediction models, as they most accurately fit the natural curved deceleration observed over time for user engagement.
To see how real LTV is calcualted, see the details in the "How is Real LTV Calculated?" section above.
To see how the LTV prediction is forecasted, see the details in the "How is Predicted LTV Calculated?" section above.
