Required to Start using Revenue Reports
Revenue Reports tracks your game's revenue from all your in-game monetized sources. Requisites for using Revenue Reports will depend on how you monetize in your game. See the table below for requirements based on how you monetize:
| Monetization Channels | Required Integrations |
|---|---|
| App monetizes with both In-App Purchases & In-Game Ads | 1. Integrate ByteBrew SDK 2. Implement Purchase Validation (or Purchase Tracking) in your game. 3. Implement Ad Events to stream in impression level revenue from your game. |
| App only monetizes with In-App Ads | 1. Integrate ByteBrew SDK 2. Implement Ad Events to stream in impression level revenue from your game. |
| App only monetizes with In-App Purchases | 1. Integrate ByteBrew SDK 2. Implement Purchase Validation (or Purchase Tracking) in your game. |
How to integrate In-App Purchases
In-App Purchase integration takes place in the implementation process of the ByteBrew SDK. Go to your platform's SDK documenation page to learn how to track and validate purchases using ByteBrew. When In-app purchase tracking has been integrated, then purchases will auto-populate on the Monetization dashboards.
How to integrate In-App Ad Tracking
In-App Ads integration takes place in the implementation process of the ByteBrew SDK. Go to your platform's SDK documenation page to learn how to track ad events using ByteBrew. When in-app ad tracking has been integrated, ad events will auto-populate on the Monetization dashboards.
Building Revenue Reports
Watch Video play_circleTo start designing your customized revenue report in your app, see the sections below to learn how to build queries on the ByteBrew Revenue Report dashboard.

In the Revenue Reports dashboard there were several steps to building your query. See the following overview steps and their individual sections for a detailed step by step to building a report for your app:
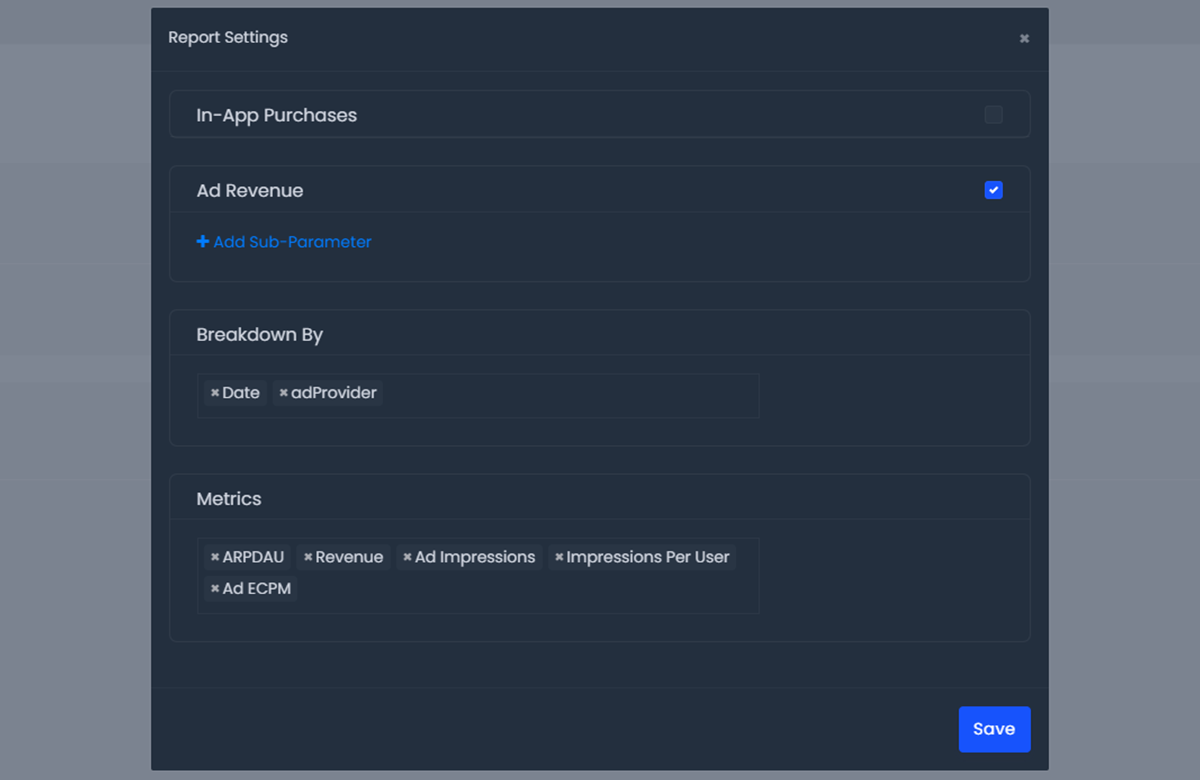
Select "Step Report" to open the Report Settings
Select the revenue events to analyze in your report.
Optional: Choose how you want to Breakdown your query. You can select up to 2 breakdowns.
Choose the metrics you want queried in your report. See list below for available revenue metrics:
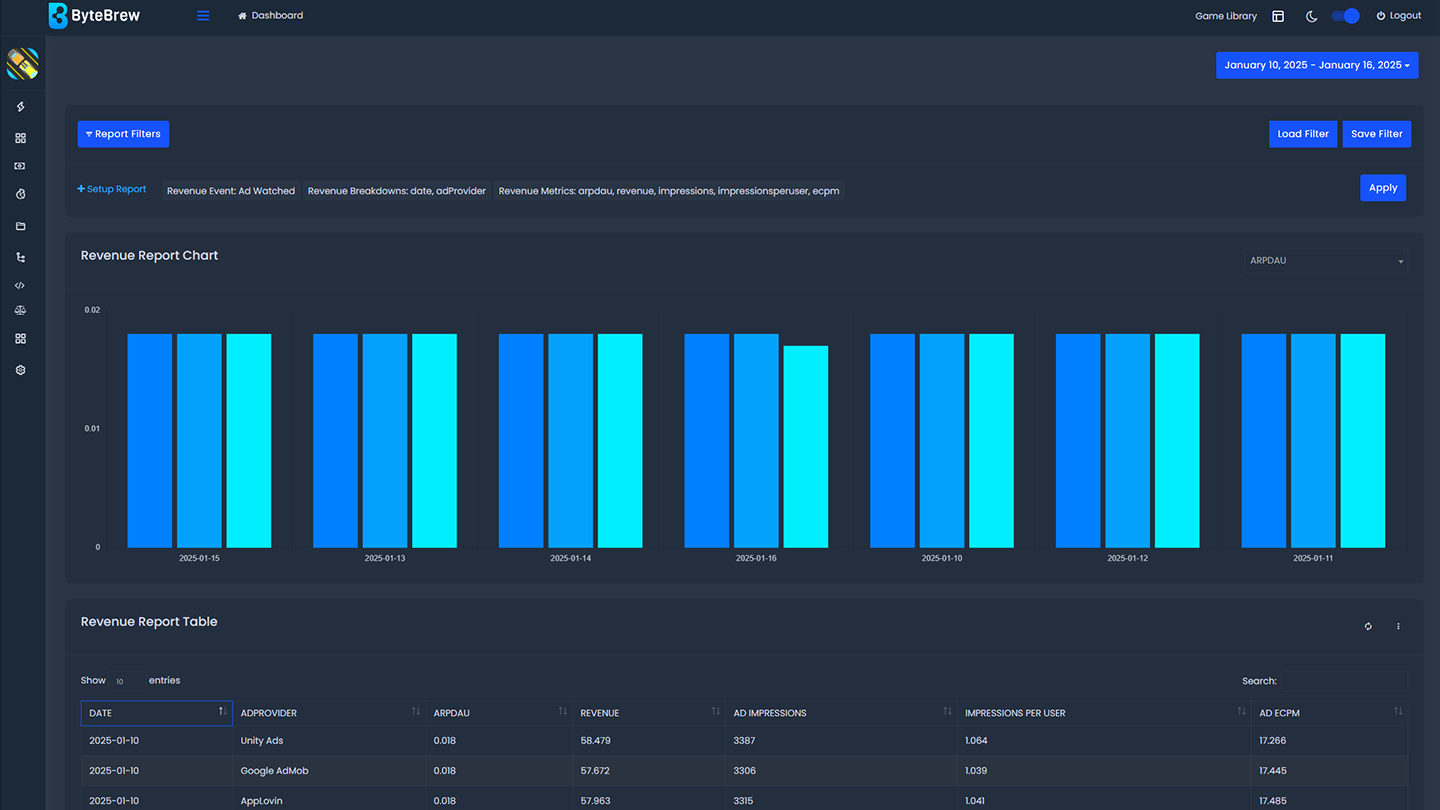
Revenue Report Chart
The metrics you select when setting up your revenue report will be visualized in this chart. You can visualize each metric you selected by switching the selected metric is the dropdown on the chart.

Revenue Report Data Table
In addition to the chart, the Revenue Report will output a datatable with all the metrics you've selected

Saving Revenue Reports
After building your query, you have the option to save it; so you don't need to re-build the same query each time. Follow the steps below to save a Mechanic:
After building your Revenue Report, open the Save Filters panel by clicking the "Save Filters" button.
Type the name of the filter you're saving to remember what the filter you built.
Loading Revenue Reports
Any Revenue Report you save can be reloaded later by clicking the "Load Filters" button to open the Load Filters panel. See the options list below the Load Filter panel:
Exporting Charts
Every chart on the ByteBrew dashboard is able to be exported via .csv by clicking on the three dots icon in the corner of the chart.
FAQs
All analytics on ByteBrew show up in real-time. There aren't any wait periods like other platforms. Seconds after your user's play your game, you will see data start showing up on the dashboard.
This depends on how you monetize your games. If you have IAPs in your game, then you must initialize the ByteBrew SDK and implement Purchase Tracking (or Purchase Validation). If you only use in-app ads to monetize, then you must initialize the ByteBrew SDK and implement Ad Event Tracking. If you use both IAPs and in-app ads, then you must implement the ByteBrew SDK, and integrate both purchase and ad events.
The dashboard operates in UTC time.
Yes, ad revenue in ad events should be sent in USD.
If revenue is not displayed as expected, check (1) that you've properly implemented both purchase and ad events, and (2) test the output of each event type to ensure the revenue values are being sent to ByteBrew as expected.
No, ByteBrew is not able to track purchase refunding from the app stores.
