Required to Start using Retention Analytics
To start using the Retention Analytics Dashboard, you must first have initialized the ByteBrew SDK in your game.
Retention Analytics Charts
See the table below for a breakdown of all the Retention Analytics Charts.
| Daily Retention Chart & Heatmap | Retention chart calculates the daily user retention of players in the developer's games for up to 30 days in a visual graph. This is shown as a graph and heatmap. |
|---|---|
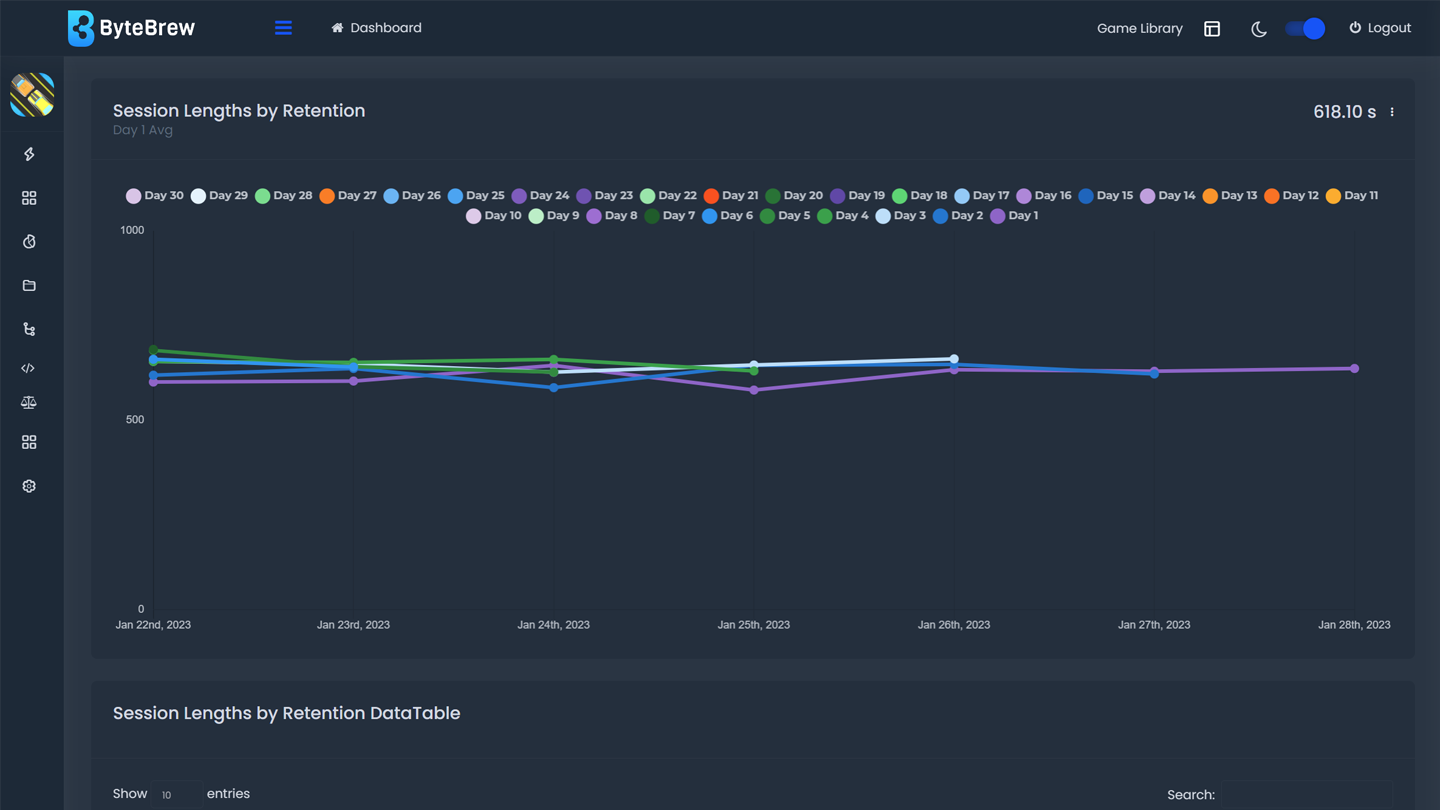
| Session Length by Retention Chart & Heatmap | This metric calculates daily average session length broken down by each day your users return to play your game or app. This is shown as both a graph and heatmap. |
| Session Count by Retention Chart & Heatmap | This metric calculates the number of daily average sessions per user broken down by each day your users return to play your game or app. This is shown as both a graph and heatmap. |
| Playtime by Retention Chart & Heatmap | This metric calculates the daily average playtime per user broken down by each day your users return to play your game or app. |
| Cumulative Playtime by Retention Chart & Heatmap | This metric calculates the total summed playtime of users based on the day they return to play your game of app. For example, cumulative playtime of a user returning on Day 4 will sum their playtime of Day 0, 1, 2, 3 and 4 to show the total cumulative playtime of that user. |
Timespan Settings
At the top of the Retention Analytics dashboard you have the power to set the retaining date range for all your retention metrics using the Timespan Settings. See below for the options for settings your timespan:

Choosing Custom retention range, you can set the exact dates you want to see in all charts on Retention Analytics.
Choosing Custom retention range, you can set the exact dates you want to see in all charts on Retention Analytics.
Choosing Custom retention range, you can set the exact dates you want to see in all charts on Retention Analytics.
Exporting Charts
Every chart on the ByteBrew dashboard is able to be exported via .csv by clicking on the three dots icon in the corner of the chart.
FAQs
All analytics on ByteBrew shows up in real-time. There aren't any wait periods like other platforms. Seconds after your user's play your game, you will see data start showing up on the dashboard.
To see data populate in the Retention Analytics dashboard, first make sure to initialize the ByteBrew SDK in your project.
The dashboard operates in UTC time.
If you are having trouble seeing your data show up on the dashboard while testing your game, make sure that you've integrated the ByteBrew SDK correctly.
