Required to Start using Cohorts
To start using Cohorts in Custom Workspace, you must first have initialized the ByteBrew SDK and integrated custom events in your game.
Building Cohorts
Watch Video play_circleUsing Cohorts dashboard you have the ability to analyze your player's user behavior by taking any two custom events you're tracking in your game or app and see how players transition from the one event to the other. See the sections below to learn how to build cohorts on the ByteBrew Cohort dashboard.
Setting up a Custom Cohort
To setup a Custom Cohort open the Cohort Settings panel by clicking the "Create Cohort" button. Follow the steps below to set up your Cohort:
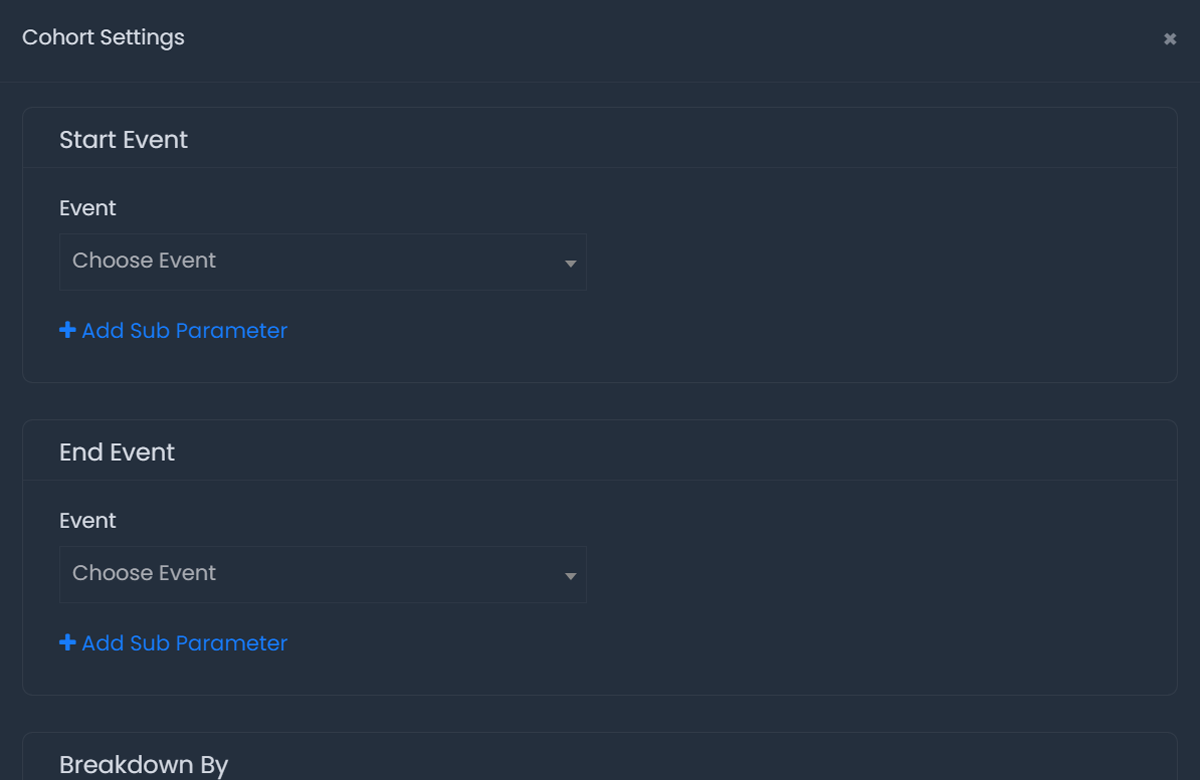
Select a Start Event for the Cohort: The start event can be a custom event you're tracking or a basic event we auto track in the SDK
Optional: Add subparameters you want that custom event you've selected as the start event to be filtered by.
Select an End Event for the Cohort: The end event can be a custom event you're tracking or a basic event we auto track in the SDK
Optional: Add subparameters you want that custom event you've selected as the end event to be filtered by.
Optional: Choose the metric you'd like to breakdown your Cohort by under Breakdown By. Default breakdown is Date.
Optional: Add an Aggregate By to output a calculation using the custom events you've setup in the Cohort. See below section on Aggregate By for more info about aggregate functions in Cohorts.
Aggregate By
Under the Cohort Settings panel you have the option to add a Aggregate function cohort setup. Adding an Aggregator will allow you to output a calculation on the values in your cohort using any of the aggregate function options. For example: if your cohort's goal is to visualize the average number of purchases made by your players, you could build a cohort where "Start Event = User Install" and "End Event = Purchase" with an "Aggregate By" function of "AVG". This cohort will output, the average number of purchases made by players each day they play. See steps below on how to add an Aggregator to your Cohort:
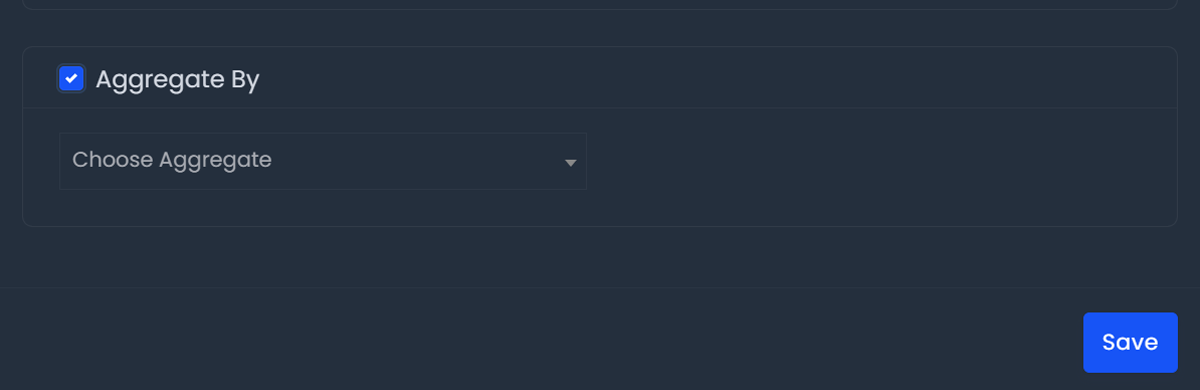
Enable Aggregate By by clicking the checkmark box.
After enabling Aggregate By, an Aggregator dropdown will appear. Under that dropdown, pick the aggregate function you'd like to have your cohort aggregate by. You are limited to one aggregate function per query. See below list to see the full list of options of aggregators:
Timespan Settings
In the Cohort Settings panel you also have the power to set a specific date range for your cohort query using Timespan Settings. See below for the options for settings your timespan:
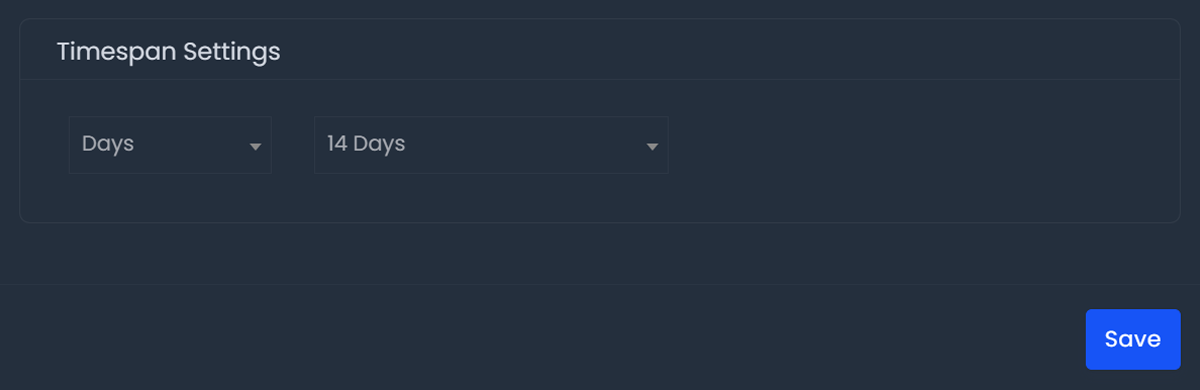
Choosing Custom cohort range, you can set the exact dates you want to see in your cohort query.
Choosing Custom cohort range, you can set the exact dates you want to see in your cohort query.
Choosing Custom cohort range, you can set the exact dates you want to see in your cohort query.
Apply Filters to Cohorts
Cohorts are filterable by our extensive filter set. All available filters can be found under the "Cohorts Filters" button. To add filters to your Cohort go into the Cohort Filters panel and select the filters you'd like to apply.
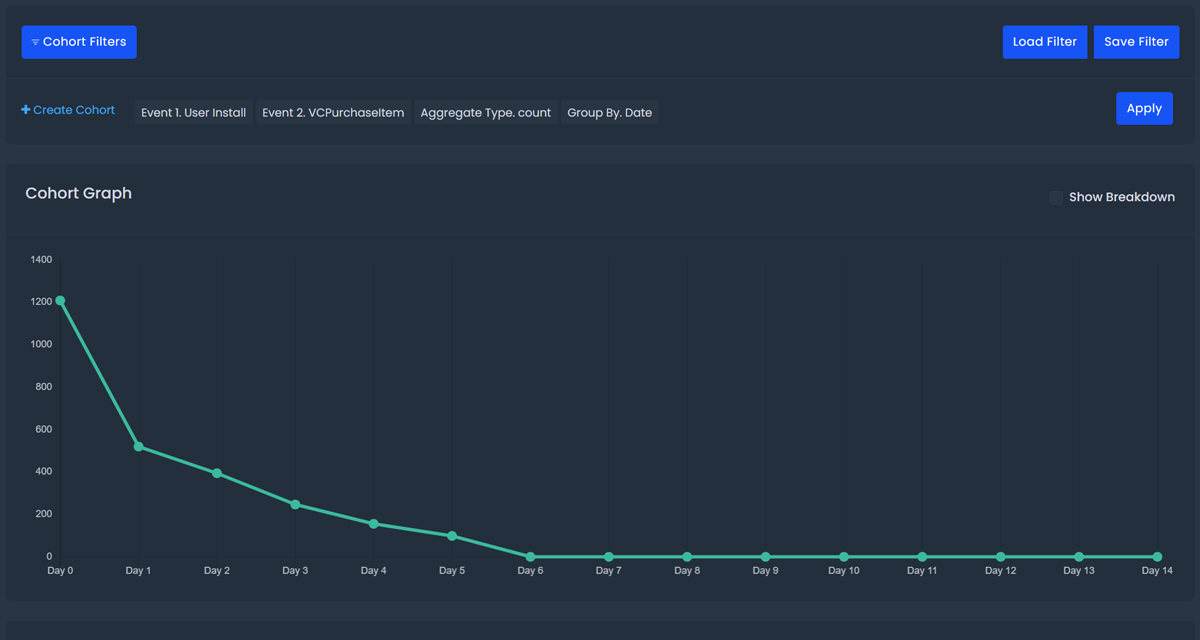
Cohort Graph
Cohorts will output a visual graph of the cohort query you build. This graph will show a line based on the average values of each column in your query. Hovering over the graph's bars you will see the name of the column the point represents and the cohort statistic connected to the point.
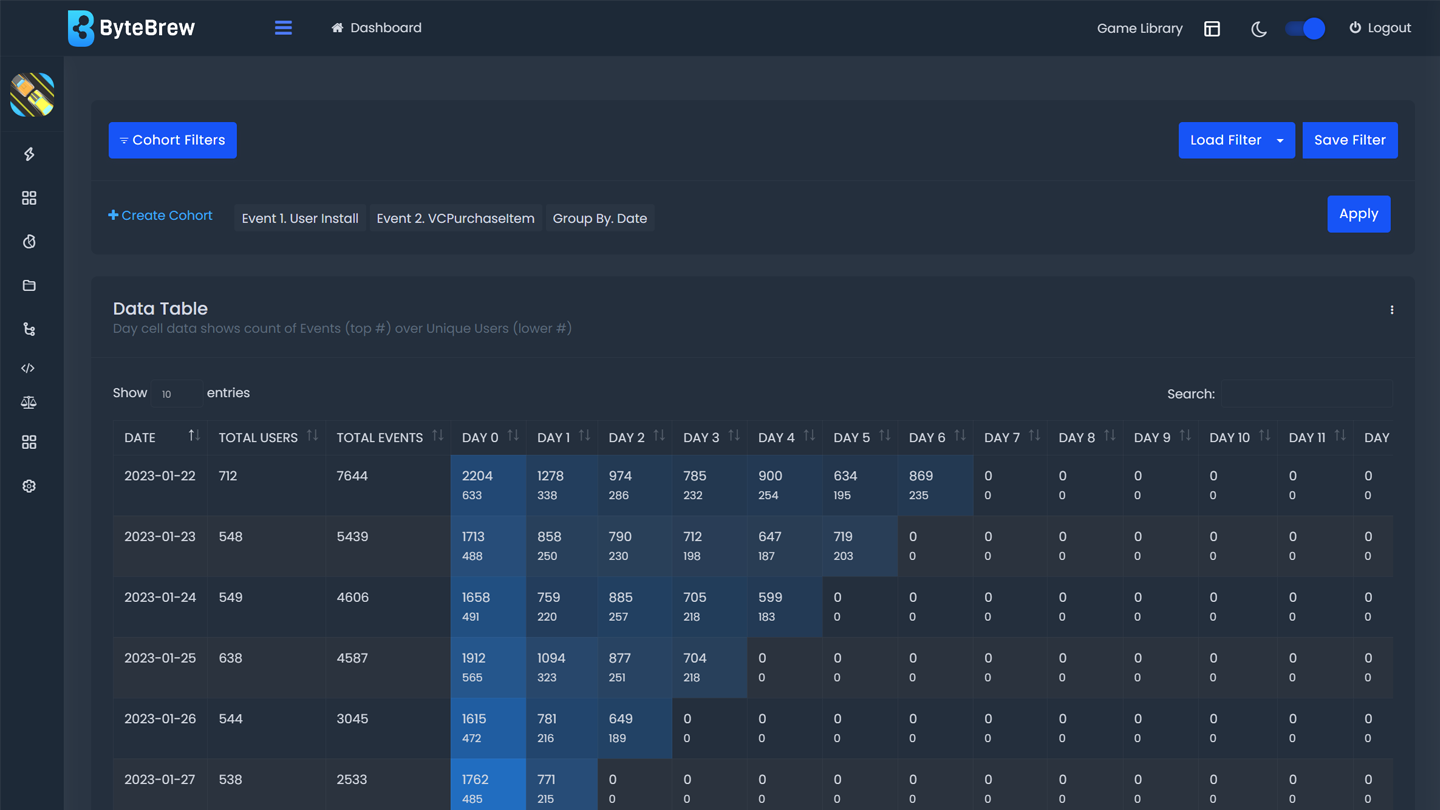
Cohorts Datatable Heatmap
In addition to the chart, Cohorts will output a heatmap datatable. In the datatable you will see the following information in the table below:
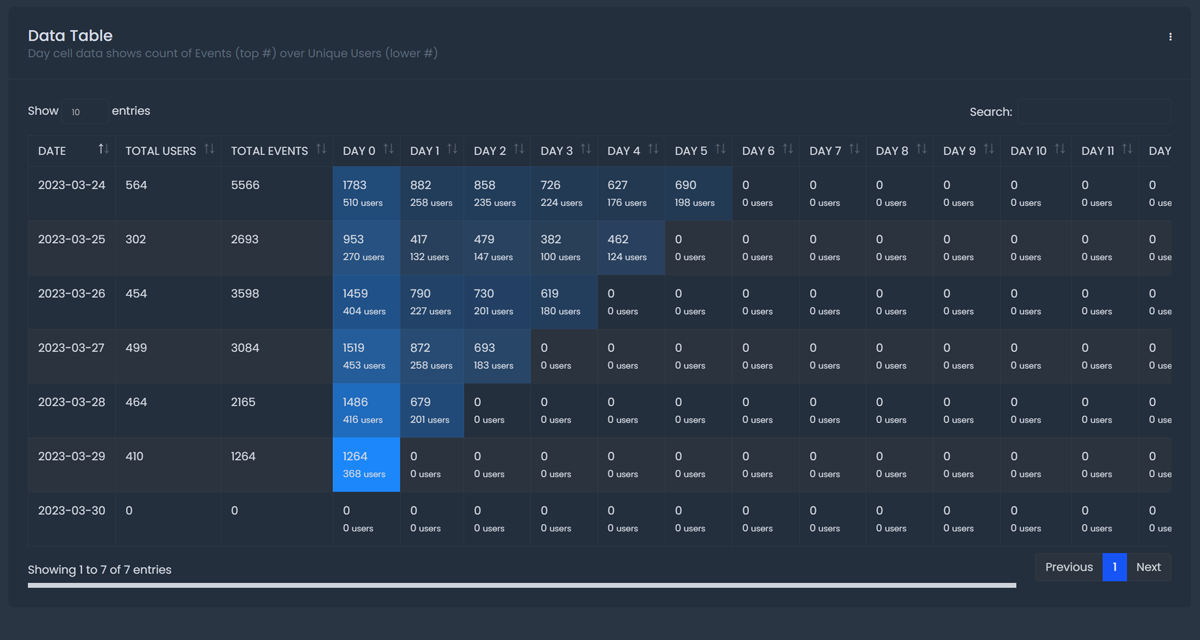
| Breakdown | First column in the table will be the breakdown selected when building the cohort. Default breakdown is Date |
|---|---|
| Total Users | Total count of users for each row in the Cohort. |
| Total Events | Total count of end events that users performed for each row in the Cohort. |
| Cohort Heatmap Table Output | The cohort output of cells that make up the rest of the Cohort datatable. Inside each cell is two values: (1) The Top Number = Number of Events, (2) The Bottom Number = Number of Users |
Saving Cohorts
After building a Cohorts, you have the option to save it; so you don't need to re-build the same cohort query each time. Follow the steps below to save a cohort:
After building your cohort, open the Save Filters panel by clicking the "Save Filters" button.
Type the name of the filter you're saving to remember what the filter you built.
Optional: Create Chart You have the option with Custom Workspace to save the cohort as a persistent custom cohort chart that will populate in real-time, continously in your "Saved Cohorts" dashboard under the "Saved Dashboards" tab of the dashboard. To do this, click the checkmark box called "Add this query to your Saved Cohorts dashboard".
Optional: Adding Chart Info If you have opted to add this cohorts as a saved chart, you have the option to "Title", add a "Description", and choose "Chart Type" to this chart. See list below for definitions of each:
Loading Cohorts
Any Cohorts you save can be reloaded later into the Cohorts dashboard by clicking the "Load Filters" button to open the Load Filters panel. See the options list below the Load Filter panel:
Exporting Charts
Every chart on the ByteBrew dashboard is able to be exported via .csv by clicking on the three dots icon in the corner of the chart.
FAQs
Yes, in the top right corner of the Cohort Graph, you can select the "Show Breakdown" checkmark to have your chart breakdown it's values into individual lines instead of one average line.
Yes, to edit a saved Cohorts filter, load the Cohorts filter into the page to populate the saved settings, then make your changes to the filter and save your new edits over the current settings to overwrite the saved filer.
ByteBrew supports historical queries on data up to 24 months.