Required to Start using Progression
To start using the Progression Dashboard, you must first have initialized the ByteBrew SDK and integrate progression events in your game.
Progression Funnels
On the Progression dashboard, you have the ability to build funnels of your players using your tracked progression events in your game. The funnels you make on ByteBrew's Progression analytics only need to be built once and will be continously calculated in real-time to give you the most advanced view into your players gameplay.
Setting up a Progression Funnel
Setting up a progression funnel is quick and easy. At the top of the Progression dashboard, click the "Funnel Settings" button to open the Funnel Settings panel. Once you reach that page, follow the steps below to set up your progression funnel:
Select Add New Funnel Button
Choose the Funnel Environment (Ex. Candy Cane Forest, or Gumdrop Mountain)
Choose the Funnnel Stages (Ex. Level_1, Level_2). You can choose up to 50 Stages per funnel.
Save your Funnel Settings
You can create multiple progression funnels to track all at once to see your player's complete journey through your game's environments.
Removing a Progression Funnel
When you no longer need to track a progression funnel you can go to your Funnel Settings panel and click the Delete button on a funnel to remove it.
Funnel Event Data Table
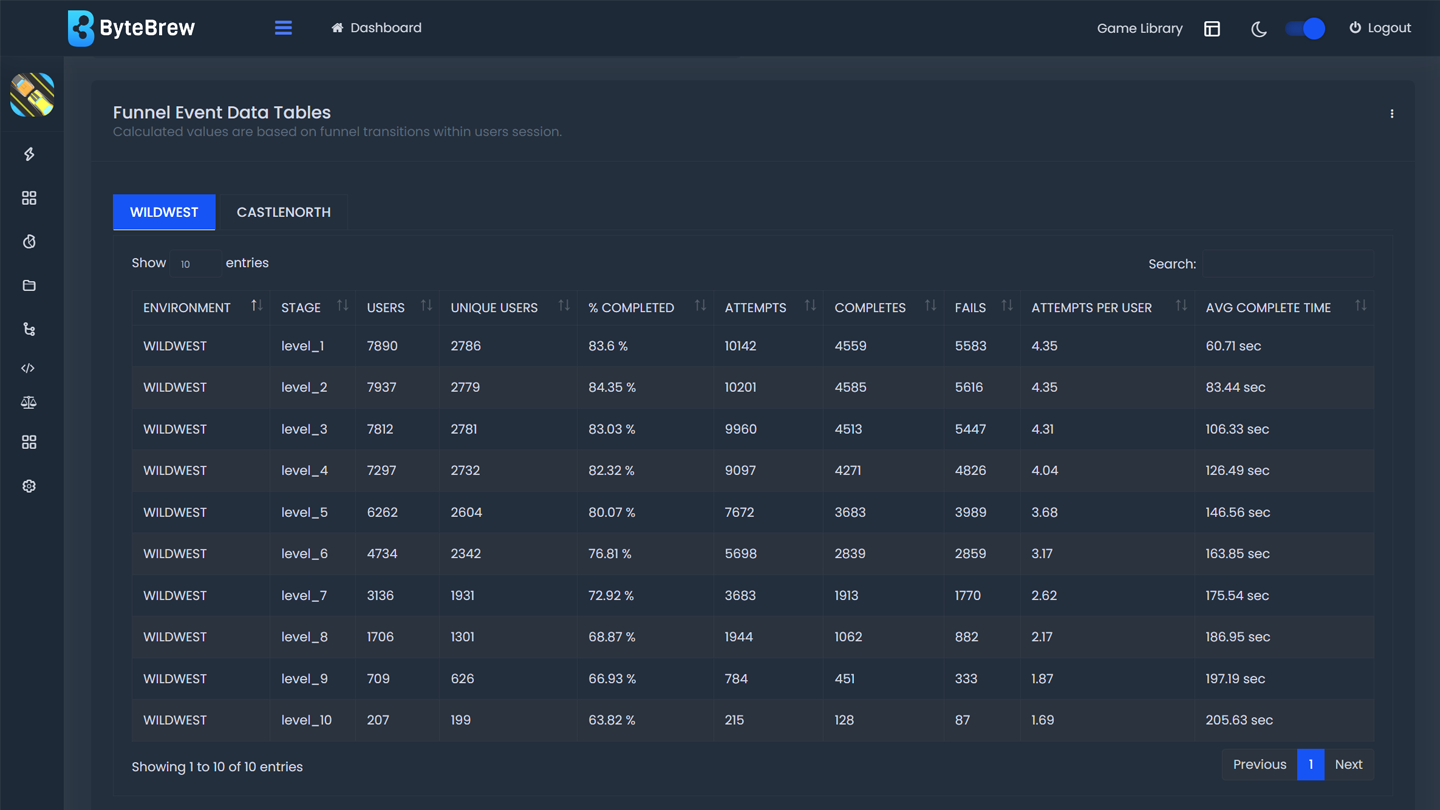
Watch Video play_circleUsing your saved progression funnels, this data table shows an in-depth breakdown of how your players start and complete each of your tracked funnel stages. See the table below to learn how each metric in the Funnel Event Data Table is calculated:
| Environment | The environment defined by the developer in the progression event. |
|---|---|
| Stage | The stage defined by the developer in the progression event. |
| Users | Total number of users who have participated in the stage based on user sessions. For example, if a user plays a stage twice in two different sessions, then 2 users will be tracked in this metric. |
| Unique Users | Total number of unique users who participated in the stage. For example, if a user plays a stage twice in two different sessions, then 1 user will be tracked in this metric. |
| % Completed | Percentage of users who completed the stage. Calculated based on the number of level starts by the number of level completes. |
| Attempts | The total count of user attempts at that stage. |
| Completes | The total count of user completes at that stage. |
| Fails | The total count of user fails at that stage. Calculated by taking the difference between attempts and completes. |
| Attempts per User | The average number of attempts it takes for a user to finish the stage. This calculated using the attempts at the stage by the unique users in the stage. |
| Average Complete Time | The average time it takes for a user to complete the stage from start to complete. |
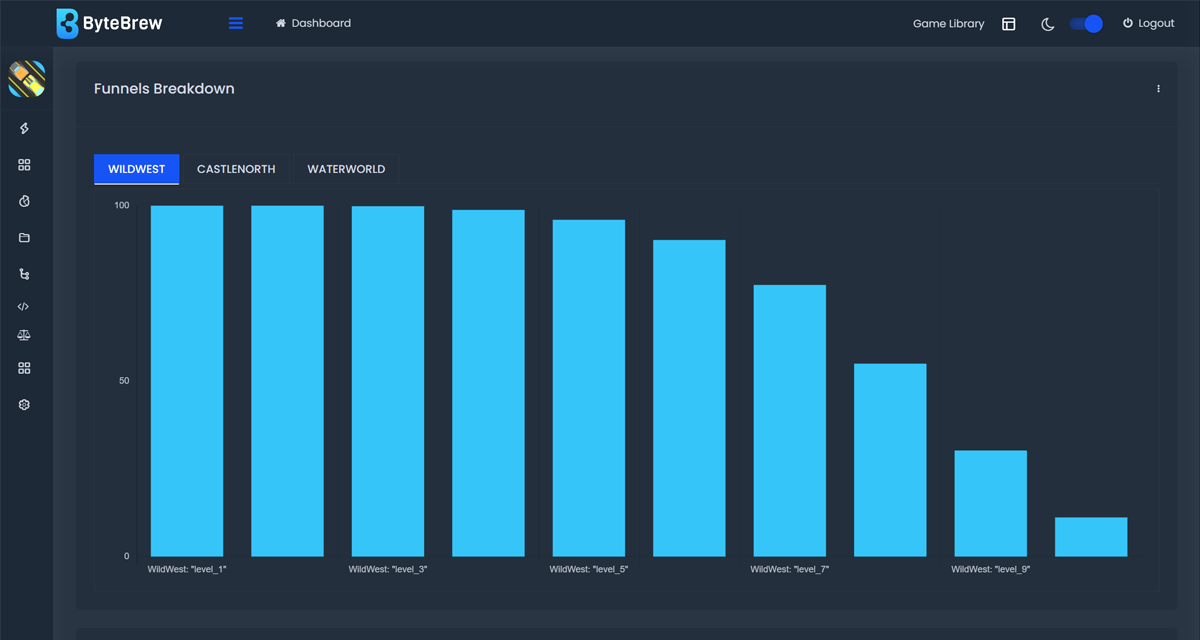
Funnel Breakdown
Using your saved progression funnels, this funnel chart shows the percent of users who transition from the first stage to every following stage in real-time. For example, if 5 users complete "Level 1", 3 of those 5 users complete "Level 2", and 1 of those 5 user complete "Level 3", then the percentage of users who transition through your funnel would look like the following table:
| Stage 1 | 5 Users | 100% |
|---|---|---|
| Stage 2 | 3 Users | 60% |
| Stage 3 | 1 Users | 20% |
Each funnel you save under the Progression Settings panel will be auto-created on this breakdown, and paginated under the name of the progression environment (Ex. WildWest, CastleNorth, WaterWorld) set up in the funnel.
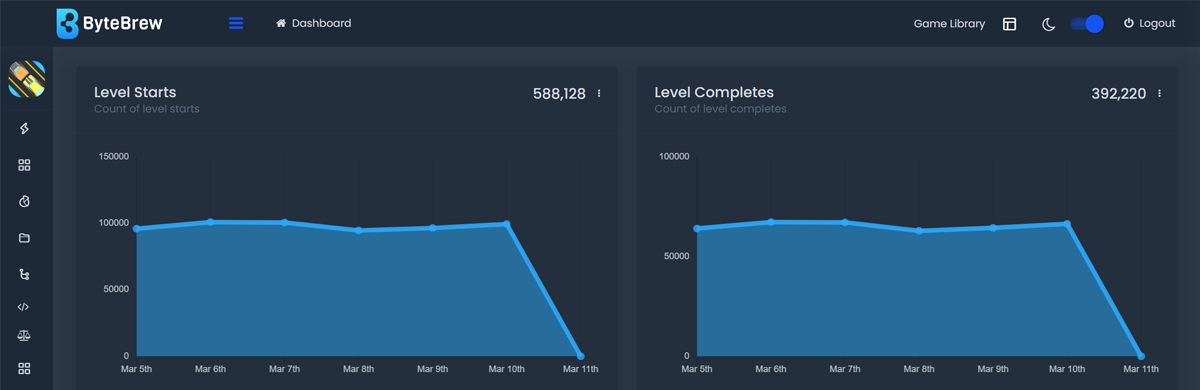
Progression Analytics Charts
Progression analytic charts show a set of informative daily metrics for your games tracked progression events for level starts, completes, and fails by other key metrics.
See the table below for a breakdown of all the Progression analytics charts:
| Level Starts | Total daily number of level start events tracked within the date range queried. |
|---|---|
| Level Completes | Total daily number of level complete events tracked within the date range queried. |
| Level Fails | Total daily number of level failed events tracked within the date range queried. |
| Level Start by DAU | Total daily number of level start events tracked by the DAU on the days queried. |
| Level Complete by DAU | Total daily number of level complete events tracked by the DAU on the days queried. |
| Level Fails by DAU | Total daily number of level failed events tracked by the DAU on the days queried. |
| Win/Loss by DAU | Daily ratio of tracked level complete events by level failed events over the number of DAU on the days queried. |
| Scores by DAU | Number of scores tracked in your game by the number of DAU on the days queried. |
Exporting Charts
Every chart on the ByteBrew dashboard is able to be exported via .csv by clicking on the three dots icon in the corner of the chart.
FAQs
All analytics on ByteBrew shows up in real-time. There aren't any wait periods like other platforms. Seconds after your user's play your game, you will see data start showing up on the dashboard.
To start using Progression, you must first have initialized the ByteBrew SDK in your game and tracked progression events.
The dashboard operates in UTC time.
If you funnel is not loading, check to make sure that all the progression events you've used to build your funnel are consecutive steps. (Ex. Level 1, Level 2, Level 3, etc.)
These two charts calculate their values differently. Funnel Graph shows the percent of users who transition from one step to the next step, while the Funnel Event Data Table will show the percent of users who transition from the start of a single step to the completion of that single step, not to the next step.
You can build up to 50 steps in a single real-time progression funnel.
Check your progression event integration in your game to make sure you did not list your progression start, complete, and fails all in the same location.
Progression funnels can only use progression events. Using Custom Events, you can build custom Funnels under the Custom Workspace dashboard.