Required to Start using the Performance Dashboard
To start using the Performance Dashboard, you must have completed the following items in the table below:
| Initialize ByteBrew | Initialize both ByteBrew SDK and ByteBrew Ads in your app. |
|---|---|
| Implement App Monetization Tracking | Implemented Ad Event Tracking and In-App Purchase Validation in your SDK integration for Ctrl powered LTV and Retention Campaigns. |
| Create Ad Units | Created your app's Ad Units and implemented them into your app. |
| Setup Finance Account | Completed your account's finance setup in the Finance dashboard. |
| Launch Campaigns | Launched active campaigns for your apps. |
Setup Performance Report
Setting up performance reports in a few clicks by following the steps below:
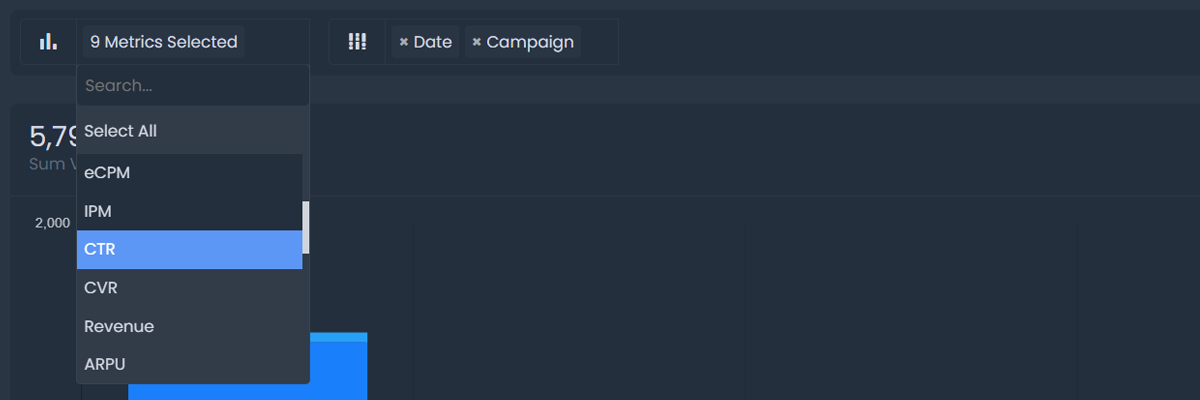
Select Metrics
Select the list of metrics you'd like to analyze from the metrics dropdown. See the list of metrics you can dive into:
| Spend | Amount spent (USD) on the campaign within the date range selected. |
|---|---|
| Impressions | Total number of impressions in the creative within the date range selected. |
| Clicks | Total number of clicks in the creative within the date range selected. |
| Installs | Total number of installs in the creative within the date range selected. |
| eCPI | Cost per Install (CPI) is the calculated average cost for each install driven within the date range selected. |
| IPM | Installs per mille (IPM) measures the number of app installs per 1,000 ad impressions within the date range selected. |
| CTR | Click through rate (CTR) is the rate of impressions that result in clicks within the date range selected. |
| CVR | Conversation rate is the rate of clicks that result in installs within the date range selected. |
| eCPM | Cost per milli is the average cost per 1,000 impressions within the date range selected. |
| eCPC | Estimated average cost per click within the date range selected. |
| Revenue | Summed revenue generated by users through both in-app purchases and ad revenue within the date range selected. |
| ARPU | Average revenue per user generated within the date range selected. ARPU uses both in-app purchases and ad revenue tracked. |
| LTV D1 | The average cumulative lifetime value of users by day 1 of your campaign. LTV uses both in-app purchases and ad revenue tracked. |
| LTV D3 | The average cumulative lifetime value of users by day 3 of your campaign. LTV uses both in-app purchases and ad revenue tracked. |
| LTV D7 | The average cumulative lifetime value of users by day 7 of your campaign. LTV uses both in-app purchases and ad revenue tracked. |
| LTV D14 | The average cumulative lifetime value of users by day 14 of your campaign. LTV uses both in-app purchases and ad revenue tracked. |
| LTV D28 | The average cumulative lifetime value of users by day 28 of your campaign. LTV uses both in-app purchases and ad revenue tracked. |
| Retention D1 | The average rate of users retaining on the 1st day after their install within the date range selected. |
| Retention D3 | The average rate of users retaining on the 3rd day after their install within the date range selected. |
| Retention D7 | The average rate of users retaining on the 7th day after their install within the date range selected. |
| Retention D14 | The average rate of users retaining on the 14th day after their install within the date range selected. |
| Retention D28 | The average rate of users retaining on the 28th day after their install within the date range selected. |
| ROAS D1 | The average return on ad spend of users by day 1 in your campaign within the date range selected. |
| ROAS D3 | The average return on ad spend of users by day 3 in your campaign within the date range selected. |
| ROAS D7 | The average return on ad spend of users by day 7 in your campaign within the date range selected. |
| ROAS D14 | The average return on ad spend of users by day 14 in your campaign within the date range selected. |
| ROAS D28 | The average return on ad spend of users by day 28 in your campaign within the date range selected. |
Choose Breakdowns
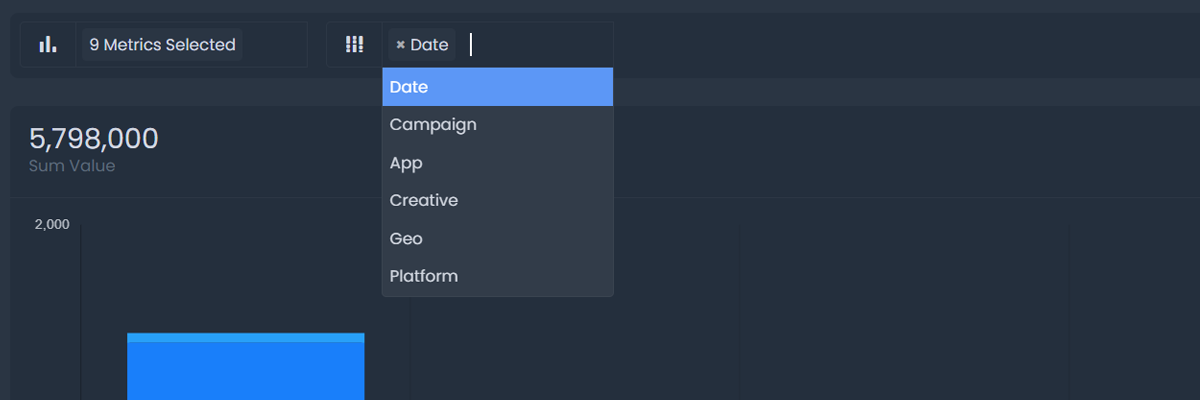
Select up to 2 Breakdowns to analyze your metrics by from the list below:
Total & Averages Row
The Performance Report displays a summary row of the metrics in the table. See list of metrics below.
| Spend | Sum of Spend across rows in table. |
|---|---|
| Impressions | Sum of Impressions across rows in table. |
| Clicks | Sum of Clicks across rows in table. |
| Installs | Sum of Installs across rows in table. |
| eCPI | Weighted average of eCPI in table, weighted by installs. |
| IPM | Weighted average of IPM in table, weighted by impressions. |
| CTR | Weighted average of CTR in table, weighted by impressions. |
| CVR | Weighted average of CVR in table, weighted by installs. |
| eCPM | Weighted average of eCPM in table, weighted by impressions. |
| eCPC | Weighted average of eCPC in table, weighted by clicks. |
| Revenue | Sum of Revenue across rows in table. |
| ARPU | Weighted average of ARPU in table, weighted by installs. |
| LTV | Weighted average of each LTV column in table, weighted by installs. |
| Retention | Weighted average of each Retention column in table, weighted by installs. |
| ROAS | Weighted average of each ROAS column in table, weighted by installs. |
Save Performance Report
You can save reports you've built by selecting, "Save Report" and naming the report. This will save all the performance metrics, breakdowns, and filter you've selected for you to load at a later time.
Load Performance Report
To load a performance report you've built, select "Select Report" to open your saved report list. Select the report you want to open and hit Apply.
Delete Performance Report
To delete a saved report, open the Saved Reports and hit the Delete option.
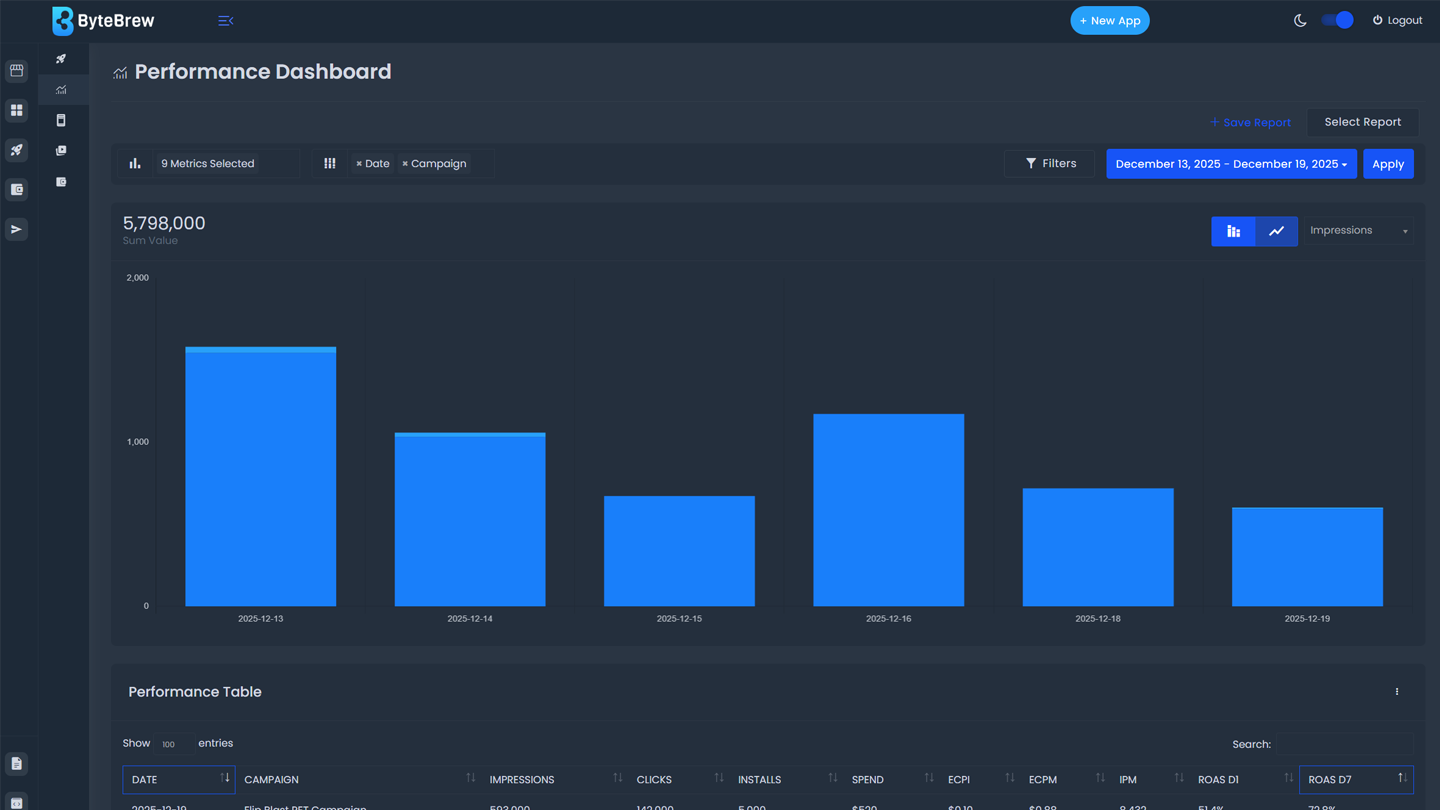
Performance Chart
The metrics you select when setting up your performance report will be visualized in this chart. You can visualize each metric you selected by switching the selected metric in the dropdown on the chart.
Performance Datatable
The performance data in the report you build will populate in the datatable.
FAQs
LTV is calculated using the real revenue tracked from both in-app purchases and ad revenue.
No, LTV on the Performance dashboard is showing the real calculated lifetime value of users using both tracked in-app purchases and ad revenue.
You can add up to 2 breakdowns to a report.
Data is shown as it occurs in your app. If there are gaps in dates in the report, then no events occurred on that date.
You can export the performance report datatable by selecting the options button and downloading the CSV.
The dashboard operates in UTC time.
All revenue metrics are in USD.
If revenue is not displayed as expected, check (1) that you've properly implemented both purchase and ad events, and (2) test the output of each event type to ensure the revenue values are being sent to ByteBrew as expected.
ByteBrew Ads is a self-attributing network that utilizes our platform's native attribution systems to track converting installs. This feature is completely free and does not require any additional costs.
No, ByteBrew Ads is a self-attributing network that utilizes our platform's native attribution systems to track converting installs. This feature is completely free and does not require any additional costs.
ByteBrew Ads will only attribute users who consent to tracking to adhere with all platform guidelines.
ByteBrew Ads is powered by Ctrl, our AI behavior engine that was trained to predict the LTV and retention of every user in real-time to deliver smarter acquisition decisions and maximize your marketing performance.
Built within ByteBrew Ads is our AI creative targeting engine, ALT. ALT is trained to select the creative in your campaign with the highest likelihood to engage for every user.
All values are in USD.
ROAS in the summary row of the Performance Report is a weighted average of the rows in the table. When breaking down data in the Performance Report by varying dimensions, ROAS average will fluctuate based on the data in the table.